



 Tested by
In my latest round of tests, the hosts whose servers answered fastest were AWS, Time4VPS and Impreza.host. I tested 186 real websites on 48 hosts with Grafana k6 in 2026 and ranked each host on how long its servers took to build an uncached page.
| Host | Server time (est.) | Uncached TTFB from Ashburn | Hosting type tested |
|---|---|---|---|
 |
64 ms | 132 ms | VPS/cloud |
 Time4VPS |
67 ms | 187 ms | VPS/cloud |
 Impreza.host |
121 ms | 258 ms | VPS/cloud |
These are tests of live websites on each host, not of identical test sites on accounts I bought. Each host's figure is the median of its 2 to 6 sites (up to 3 per hosting type), so one unusually heavy or light site can't decide a host's result. Read the results as a snapshot of real-world sites on that host, not as a lab test of its servers.
The rest of this page shows the full ranking, how I tested, and what the numbers can and can't tell you.
Key findings
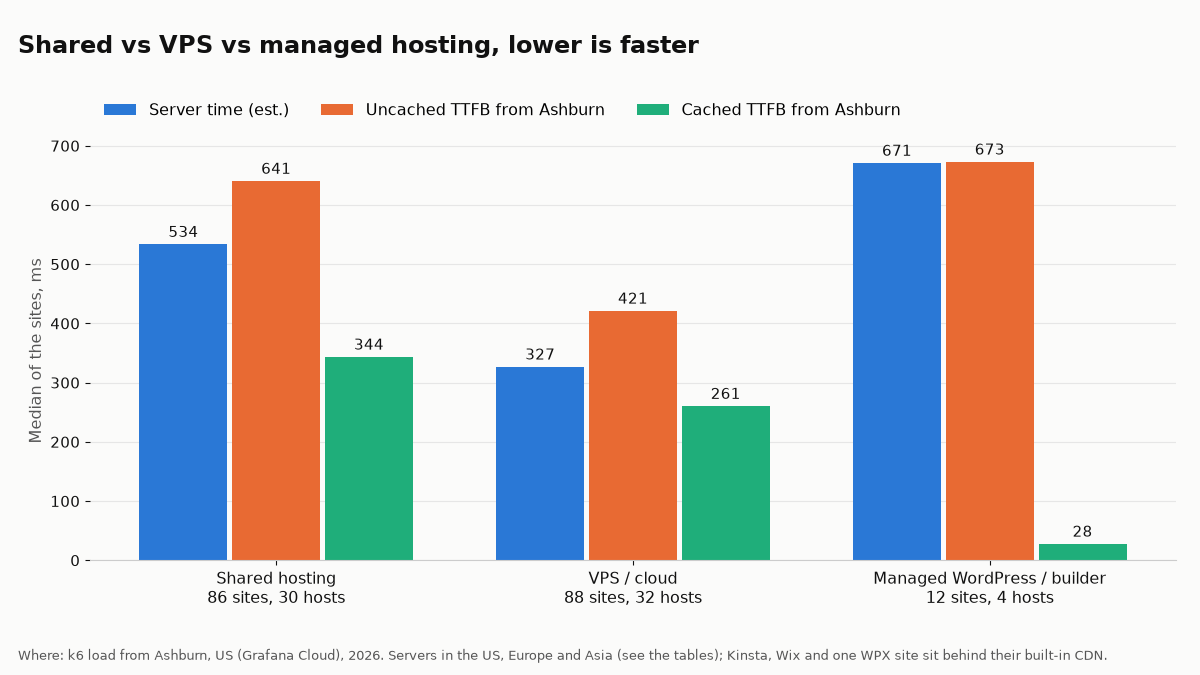
- VPS and cloud sites were the fastest group. Their median server time was 327 ms, against 534 ms for shared hosting sites and 671 ms for the 12 managed WordPress and website builder sites.
- The same host can look fast and slow. AlexHost's sites ranged from 151 ms to 15,913 ms. On many hosts, the site owner's own setup decides most of the speed, which is why each host's figure is a median.
- Distance adds a fixed cost. From Ashburn, a server in the US added a median 22 ms of round trip, Europe 81 to 148 ms and Singapore 232 ms. That's why the ranking removes it. On raw TTFB, some hosts look faster than others only because their servers are closer to Ashburn, not because the servers themselves are faster.
- Caching hides a slow server. On 60 of the 186 sites, the cached page arrived in less than half the uncached time. Cloudways' sites dropped from a median 1,163 ms uncached to 44 ms cached.
- Errors were rare. The 186 runs used here had 0 failed requests between them.
Provider report card
The grade compares each host with the other 47 on server time, the ranking figure explained below. I split the 48 hosts into five near-equal groups: A for the fastest fifth, then B, C, D and E for the slowest fifth. A grade is relative to this round of tests, not a pass or fail mark.
| Rank | Host | Hosting type tested | Sites | Server time (est.) | Grade |
|---|---|---|---|---|---|
| 1 | |
VPS/cloud | 3 | 64 ms | A |
| 2 | Time4VPS |
VPS/cloud | 3 | 67 ms | A |
| 3 | Impreza.host |
VPS/cloud | 3 | 121 ms | A |
| 4 |  Namecheap |
Shared | 3 | 125 ms | A |
| 5 |  |
VPS/cloud | 3 | 180 ms | A |
| 6 |  |
Shared, VPS/cloud | 6 | 193 ms | A |
| 7 |  |
VPS/cloud | 3 | 200 ms | A |
| 8 |  VPSDime |
VPS/cloud | 1 | 203 ms | A |
| 9 |  Hetzner |
Shared, VPS/cloud | 6 | 205 ms | A |
| 10 |  Kinsta |
Managed | 3 | 227 ms | A |
| 11 |  Bluehost |
Shared, VPS/cloud | 5 | 233 ms | B |
| 12 |  |
Shared | 2 | 269 ms | B |
| 13 |  |
VPS/cloud | 3 | 282 ms | B |
| 14 |  GoDaddy |
Shared | 3 | 288 ms | B |
| 15 |  |
VPS/cloud | 3 | 358 ms | B |
| 16 |  Infomaniak |
Shared, VPS/cloud | 6 | 361 ms | B |
| 17 |  |
Shared | 3 | 404 ms | B |
| 18 |  AlphaVPS |
VPS/cloud | 3 | 423 ms | B |
| 19 |  Black.host |
Shared, VPS/cloud | 6 | 425 ms | B |
| 20 |  Hosting.com (formerly A2 Hosting) |
Shared, VPS/cloud | 6 | 425 ms | B |
| 21 |  |
Shared | 3 | 428 ms | C |
| 22 |  |
Shared, VPS/cloud | 5 | 440 ms | C |
| 23 |  RackNerd |
Shared, VPS/cloud | 5 | 445 ms | C |
| 24 |  |
Shared | 3 | 488 ms | C |
| 25 |  AccuWeb Hosting |
Shared | 3 | 500 ms | C |
| 26 |  |
VPS/cloud | 2 | 502 ms | C |
| 27 |  |
VPS/cloud | 3 | 521 ms | C |
| 28 |  |
Shared | 3 | 608 ms | C |
| 29 |  Nexcess (Liquid Web) |
Managed | 3 | 612 ms | C |
| 30 |  OVHcloud |
Shared, VPS/cloud | 4 | 650 ms | C |
| 31 |  |
Shared, VPS/cloud | 6 | 654 ms | D |
| 32 |  |
VPS/cloud | 3 | 679 ms | D |
| 33 |  |
Shared, VPS/cloud | 6 | 695 ms | D |
| 34 |  FlokiNET |
Shared, VPS/cloud | 6 | 705 ms | D |
| 35 |  |
Managed | 3 | 718 ms | D |
| 36 |  |
Shared, VPS/cloud | 6 | 860 ms | D |
| 37 |  |
Managed | 3 | 865 ms | D |
| 38 |  Ultahost |
Shared, VPS/cloud | 6 | 930 ms | D |
| 39 |  |
Shared, VPS/cloud | 6 | 995 ms | D |
| 40 |  o2switch |
Shared | 3 | 1,117 ms | E |
| 41 |  |
VPS/cloud | 3 | 1,142 ms | E |
| 42 |  DreamHost |
Shared, VPS/cloud | 6 | 1,142 ms | E |
| 43 |  Ikoula |
Shared, VPS/cloud | 4 | 1,181 ms | E |
| 44 |  |
VPS/cloud | 3 | 1,314 ms | E |
| 45 |  WPX Hosting |
Shared | 3 | 1,395 ms | E |
| 46 |  |
Shared, VPS/cloud | 6 | 1,404 ms | E |
| 47 |  The Onion Host |
Shared | 2 | 1,519 ms | E |
| 48 |  MochaHost |
Shared | 3 | 3,797 ms | E |
The rest of this page is the same data, sorted by other measurements.
How I tested
Every test used Grafana k6, run in Grafana Cloud from its Ashburn, US load zone. The same location, settings and test length applied to every site, so the numbers compare hosts rather than test locations.
- Load: 5 virtual users sharing a cap of 1 request per second, for 2 minutes, with a 1 to 3 second pause between page views. That's light traffic, not a stress test.
- Pages: one public page per site, requested with a normal GET. No logins, carts, forms or admin pages.
- Two kinds of request: every other request added a random query string, which most page caches treat as a new page. Those uncached requests reach the server itself; the normal ones show what visitors get from the cache.
- Requests: 26,447 requests across the 186 runs used here, all in 2026.
Server time: removing distance
A page requested from Ashburn always includes one network round trip: a server in Germany starts about 100 ms behind one in Virginia before it does any work. Ranking on raw TTFB would punish every host with servers outside the US.
So the ranking uses server time: the average uncached TTFB minus the round trip to that server. For 141 of the 186 sites the round trip is estimated from k6's connection times; for the other 45 it was measured directly. That's why the tables say "est.".
For sites behind a CDN, the round trip ends at the CDN's nearest location, so their server time still includes the trip from the CDN to the real server.
Which websites
The test sites are live websites, mostly run by other customers of each host; a few are client sites I manage. None of them is one of my own sites. Each site's hosting was checked from its DNS records, the network that owns its IP address (ASN) and the IP's registration data, not from its nameservers.
- Up to 3 sites per hosting type a host sells, so a host with shared and VPS plans has up to 6. Each host's figure is the median of its sites.
- Comparable pages only. Sites whose tested page was under 30 KB (almost empty, or static) or over 500 KB (very heavy page-builder output) were replaced, because they say more about the page than about the host.
- Built-in CDNs stay in. Kinsta (Cloudflare), Wix (Fastly) and one WPX site sit behind the CDN that comes with the product, so it counts as part of the host's service. Their server location is hidden behind it.
- Caching plugins stay in. The uncached request bypasses them, so they don't change the ranking.
- Not counted twice: Cloudways sites run on DigitalOcean and Vultr servers, but they count for Cloudways only.
- Slow runs kept: 4 sites (AlexHost, DigitalOcean, MochaHost and The Onion Host) were slow enough to trip k6's safety limit and stop early, but they had no errors, so their measurements stay in.
- Fewer sites: DigitalOcean, HostGator, The Onion Host and VPSDime have fewer than 3 usable sites so far.
Test bench
| Host | Hosting type | Sites | Server location |
|---|---|---|---|
| AccuWeb Hosting |
Shared | 3 | United States |
|
VPS/cloud | 3 | Australia, United States |
|
Shared, VPS/cloud | 6 | Moldova, Netherlands, Switzerland |
| AlphaVPS |
VPS/cloud | 3 | Bulgaria, United States |
|
VPS/cloud | 3 | United States |
|
VPS/cloud | 3 | Netherlands, United States |
| Black.host |
Shared, VPS/cloud | 6 | Austria, Netherlands, United Kingdom |
| Bluehost |
Shared, VPS/cloud | 5 | United States |
|
VPS/cloud | 3 | Lithuania |
|
VPS/cloud | 3 | Canada |
|
VPS/cloud | 3 | France, United States |
|
VPS/cloud | 2 | United States |
| DreamHost |
Shared, VPS/cloud | 6 | United States |
| FlokiNET |
Shared, VPS/cloud | 6 | Iceland, Romania |
| GoDaddy |
Shared | 3 | United States |
| Hetzner |
Shared, VPS/cloud | 6 | Germany, United States |
|
Shared | 3 | Singapore |
|
Shared | 3 | Singapore, United States |
|
Shared | 2 | United States |
| Hosting.com (formerly A2 Hosting) |
Shared, VPS/cloud | 6 | Singapore, United States |
|
Shared, VPS/cloud | 5 | India, Malaysia, Singapore, United States |
| Ikoula |
Shared, VPS/cloud | 4 | France |
| Impreza.host |
VPS/cloud | 3 | Lithuania |
| Infomaniak |
Shared, VPS/cloud | 6 | Switzerland |
|
Shared | 3 | United States |
|
Shared, VPS/cloud | 6 | United States |
|
Shared, VPS/cloud | 6 | Germany, Spain, United Kingdom |
|
VPS/cloud | 3 | United States |
| Kinsta |
Managed | 3 | hidden behind Cloudflare CDN |
| MochaHost |
Shared | 3 | United States |
| Namecheap |
Shared | 3 | United States |
| Nexcess (Liquid Web) |
Managed | 3 | United States |
| o2switch |
Shared | 3 | France |
|
Shared, VPS/cloud | 6 | Iceland |
| OVHcloud |
Shared, VPS/cloud | 4 | Austria, United Kingdom |
|
Shared, VPS/cloud | 6 | Canada, France |
| RackNerd |
Shared, VPS/cloud | 5 | United States |
|
Shared, VPS/cloud | 6 | Malaysia |
|
Shared | 3 | United States |
| The Onion Host |
Shared | 2 | Ukraine |
| Time4VPS |
VPS/cloud | 3 | Lithuania |
| Ultahost |
Shared, VPS/cloud | 6 | Germany, Netherlands |
|
VPS/cloud | 3 | United States |
| VPSDime |
VPS/cloud | 1 | United States |
|
VPS/cloud | 3 | United States |
|
Managed | 3 | hidden behind Fastly CDN |
|
Managed | 3 | Taiwan |
| WPX Hosting |
Shared | 3 | United States, hidden behind WPX Cloud CDN |
Server locations come from the geolocation of each site's server IP address.
Benchmark test 1: Server time
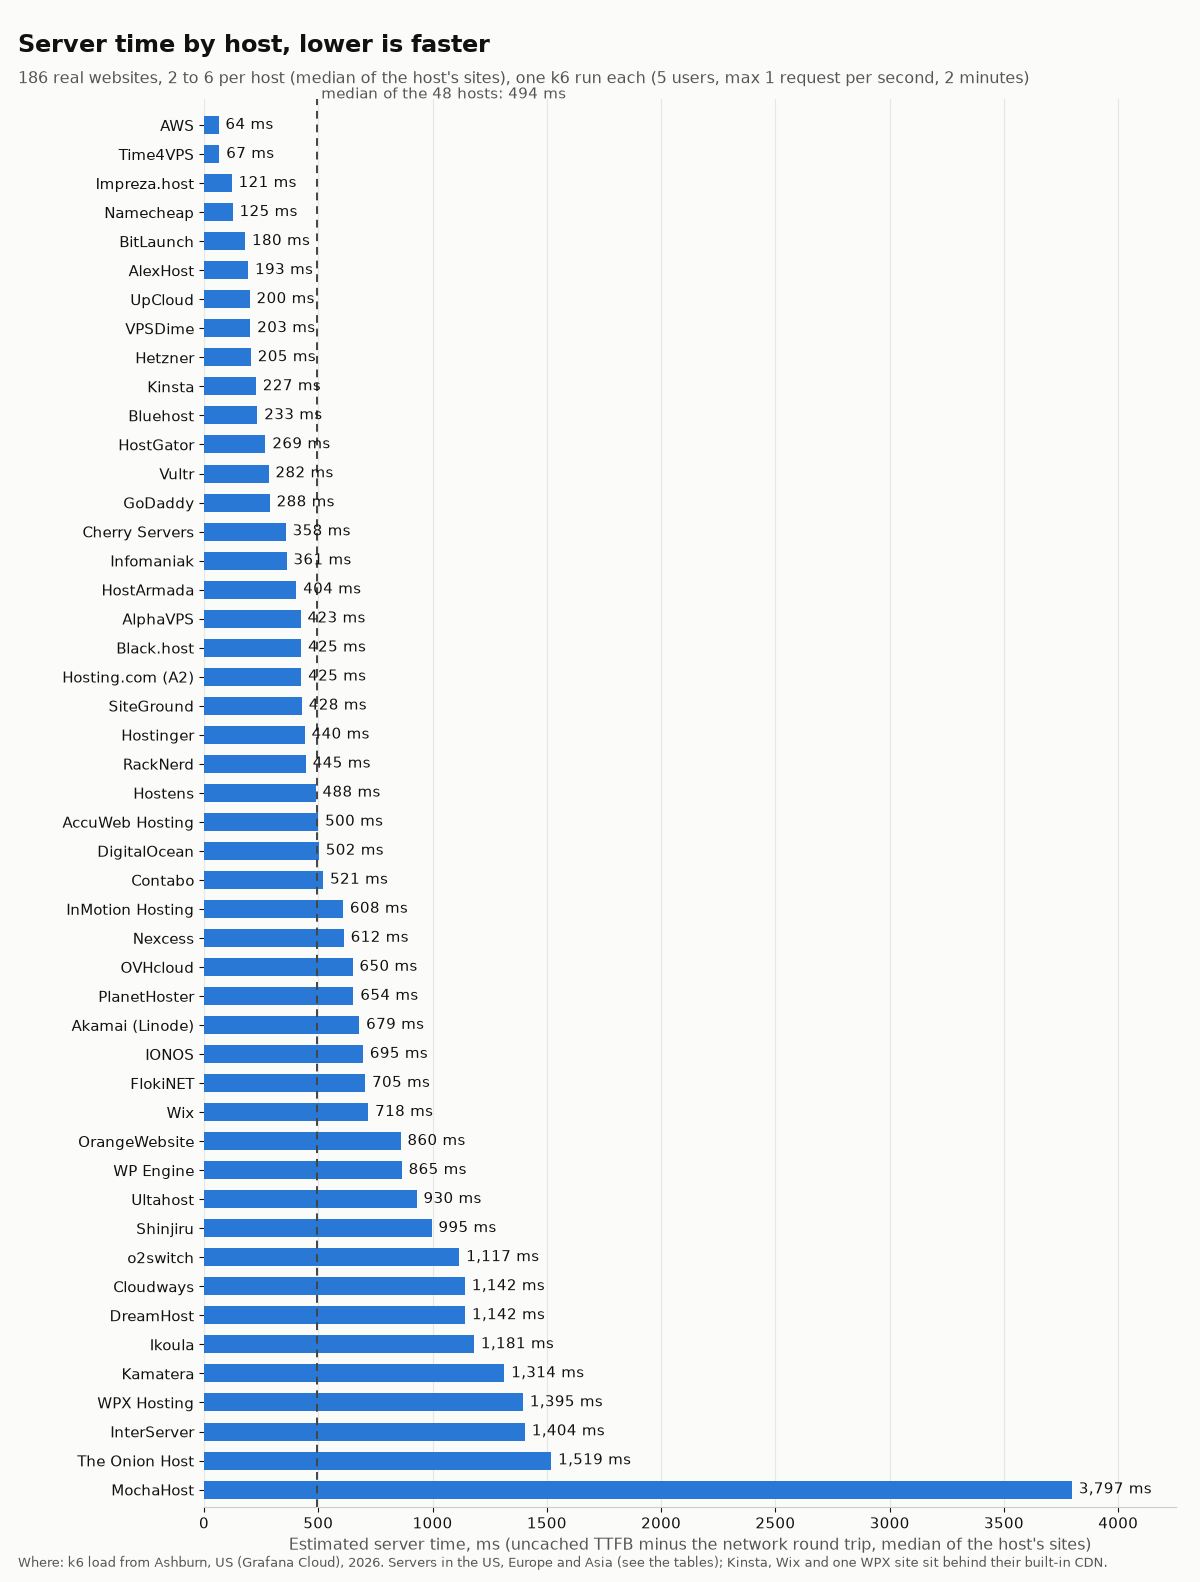
Server time is the closest figure to how fast a host's server built the page, with distance taken out. The median host came in at 494 ms. The fastest and slowest site of each host are listed too, so you can see how much a host's sites differ.
| Rank | Host | Server time (est.) | Fastest site | Slowest site | vs median |
|---|---|---|---|---|---|
| 1 | |
64 ms | 42 ms | 587 ms | -87% |
| 2 | Time4VPS |
67 ms | 33 ms | 1,554 ms | -86% |
| 3 | Impreza.host |
121 ms | 106 ms | 124 ms | -75% |
| 4 | Namecheap |
125 ms | 119 ms | 140 ms | -75% |
| 5 | |
180 ms | 129 ms | 204 ms | -64% |
| 6 | |
193 ms | 151 ms | 15,913 ms | -61% |
| 7 | |
200 ms | 155 ms | 269 ms | -60% |
| 8 | VPSDime |
203 ms | 203 ms | 203 ms | -59% |
| 9 | Hetzner |
205 ms | 96 ms | 1,085 ms | -58% |
| 10 | Kinsta |
227 ms | 150 ms | 703 ms | -54% |
| 11 | Bluehost |
233 ms | 149 ms | 386 ms | -53% |
| 12 | |
269 ms | 257 ms | 280 ms | -46% |
| 13 | |
282 ms | 219 ms | 3,159 ms | -43% |
| 14 | GoDaddy |
288 ms | 127 ms | 592 ms | -42% |
| 15 | |
358 ms | 262 ms | 810 ms | -28% |
| 16 | Infomaniak |
361 ms | 280 ms | 1,989 ms | -27% |
| 17 | |
404 ms | 270 ms | 660 ms | -18% |
| 18 | AlphaVPS |
423 ms | 152 ms | 926 ms | -14% |
| 19 | Black.host |
425 ms | 99 ms | 526 ms | -14% |
| 20 | Hosting.com (formerly A2 Hosting) |
425 ms | 45 ms | 1,356 ms | -14% |
| 21 | |
428 ms | 425 ms | 1,158 ms | -13% |
| 22 | |
440 ms | 167 ms | 723 ms | -11% |
| 23 | RackNerd |
445 ms | 117 ms | 3,391 ms | -10% |
| 24 | |
488 ms | 347 ms | 4,953 ms | -1% |
| 25 | AccuWeb Hosting |
500 ms | 342 ms | 1,241 ms | +1% |
| 26 | |
502 ms | 219 ms | 786 ms | +2% |
| 27 | |
521 ms | 455 ms | 727 ms | +6% |
| 28 | |
608 ms | 411 ms | 1,606 ms | +23% |
| 29 | Nexcess (Liquid Web) |
612 ms | 359 ms | 1,265 ms | +24% |
| 30 | OVHcloud |
650 ms | 200 ms | 826 ms | +32% |
| 31 | |
654 ms | 234 ms | 1,620 ms | +32% |
| 32 | |
679 ms | 126 ms | 1,341 ms | +38% |
| 33 | |
695 ms | 85 ms | 1,150 ms | +41% |
| 34 | FlokiNET |
705 ms | 211 ms | 1,466 ms | +43% |
| 35 | |
718 ms | 640 ms | 1,363 ms | +45% |
| 36 | |
860 ms | 128 ms | 2,707 ms | +74% |
| 37 | |
865 ms | 452 ms | 4,642 ms | +75% |
| 38 | Ultahost |
930 ms | 166 ms | 7,622 ms | +88% |
| 39 | |
995 ms | 278 ms | 1,997 ms | +102% |
| 40 | o2switch |
1,117 ms | 1,093 ms | 1,559 ms | +126% |
| 41 | |
1,142 ms | 505 ms | 1,151 ms | +131% |
| 42 | DreamHost |
1,142 ms | 239 ms | 4,447 ms | +131% |
| 43 | Ikoula |
1,181 ms | 99 ms | 3,158 ms | +139% |
| 44 | |
1,314 ms | 525 ms | 2,341 ms | +166% |
| 45 | WPX Hosting |
1,395 ms | 226 ms | 1,770 ms | +183% |
| 46 | |
1,404 ms | 110 ms | 2,375 ms | +184% |
| 47 | The Onion Host |
1,519 ms | 1,515 ms | 1,523 ms | +208% |
| 48 | MochaHost |
3,797 ms | 390 ms | 12,363 ms | +669% |
Several hosts have one fast and one very slow site: AlexHost, DreamHost, Hostens, Ikoula, InterServer, OrangeWebsite, RackNerd, Ultahost and Vultr each had a site under 350 ms and another over 2,000 ms. The median keeps that single slow site from deciding their place.
Benchmark test 2: Uncached TTFB from Ashburn
This is the raw figure before distance is removed: how long the first byte of an uncached page took to reach Ashburn. It's what a US visitor gets when the cache doesn't help, for example on a logged-in page or a fresh search result.
| Rank | Host | Uncached TTFB from Ashburn | Server time (est.) | Server location |
|---|---|---|---|---|
| 1 | |
132 ms | 64 ms | United States |
| 2 | Time4VPS |
187 ms | 67 ms | Lithuania |
| 3 | |
207 ms | 200 ms | United States |
| 4 | |
221 ms | 180 ms | Netherlands, United States |
| 5 | Kinsta |
229 ms | 227 ms | hidden behind Cloudflare CDN |
| 6 | VPSDime |
233 ms | 203 ms | United States |
| 7 | Namecheap |
245 ms | 125 ms | United States |
| 8 | Impreza.host |
258 ms | 121 ms | Lithuania |
| 9 | |
298 ms | 269 ms | United States |
| 10 | Bluehost |
301 ms | 233 ms | United States |
| 11 | |
304 ms | 282 ms | United States |
| 12 | Hetzner |
311 ms | 205 ms | Germany, United States |
| 13 | |
331 ms | 193 ms | Moldova, Netherlands, Switzerland |
| 14 | GoDaddy |
348 ms | 288 ms | United States |
| 15 | Infomaniak |
450 ms | 361 ms | Switzerland |
| 16 | |
459 ms | 428 ms | United States |
| 17 | Hosting.com (formerly A2 Hosting) |
466 ms | 425 ms | Singapore, United States |
| 18 | |
480 ms | 358 ms | Lithuania |
| 19 | Black.host |
507 ms | 425 ms | Austria, Netherlands, United Kingdom |
| 20 | |
510 ms | 502 ms | United States |
| 21 | RackNerd |
511 ms | 445 ms | United States |
| 22 | |
533 ms | 521 ms | France, United States |
| 23 | AccuWeb Hosting |
546 ms | 500 ms | United States |
| 24 | AlphaVPS |
569 ms | 423 ms | Bulgaria, United States |
| 25 | |
575 ms | 488 ms | Singapore, United States |
| 26 | |
582 ms | 440 ms | India, Malaysia, Singapore, United States |
| 27 | Nexcess (Liquid Web) |
634 ms | 612 ms | United States |
| 28 | |
654 ms | 404 ms | Singapore |
| 29 | |
669 ms | 608 ms | United States |
| 30 | |
704 ms | 654 ms | Canada, France |
| 31 | |
720 ms | 718 ms | hidden behind Fastly CDN |
| 32 | OVHcloud |
732 ms | 650 ms | Austria, United Kingdom |
| 33 | FlokiNET |
833 ms | 705 ms | Iceland, Romania |
| 34 | |
840 ms | 695 ms | Germany, Spain, United Kingdom |
| 35 | |
870 ms | 679 ms | Australia, United States |
| 36 | |
966 ms | 860 ms | Iceland |
| 37 | Ultahost |
1,019 ms | 930 ms | Germany, Netherlands |
| 38 | |
1,045 ms | 865 ms | Taiwan |
| 39 | DreamHost |
1,145 ms | 1,142 ms | United States |
| 40 | |
1,163 ms | 1,142 ms | Canada |
| 41 | o2switch |
1,203 ms | 1,117 ms | France |
| 42 | |
1,228 ms | 995 ms | Malaysia |
| 43 | Ikoula |
1,264 ms | 1,181 ms | France |
| 44 | |
1,321 ms | 1,314 ms | United States |
| 45 | WPX Hosting |
1,397 ms | 1,395 ms | United States, hidden behind WPX Cloud CDN |
| 46 | |
1,412 ms | 1,404 ms | United States |
| 47 | The Onion Host |
1,645 ms | 1,519 ms | Ukraine |
| 48 | MochaHost |
3,822 ms | 3,797 ms | United States |
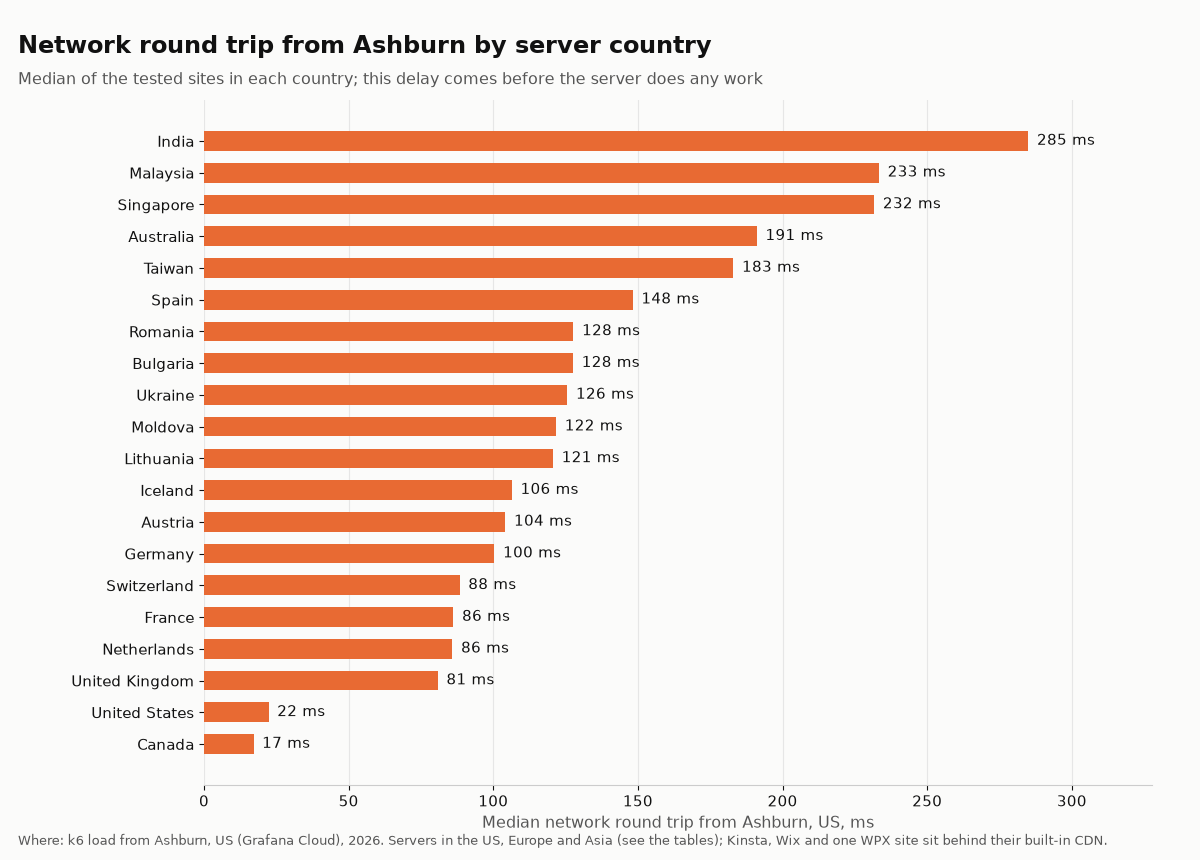
The gap between the two columns is mostly distance. HostArmada (servers in Singapore) drops from 17th on server time to 28th on raw TTFB and AlexHost (servers in Moldova, Netherlands, Switzerland) drops from 6th on server time to 13th on raw TTFB. For a US audience, a European server adds roughly 81 to 148 ms to every uncached page; for a European audience, the same server would be close.
Benchmark test 3: Cached TTFB
The cached figure is what most visitors get when a page cache or CDN answers. It mostly reflects the site owner's cache setup, not the host, so it doesn't count toward the ranking.
| Rank | Host | Cached TTFB | Uncached TTFB | Cache saved |
|---|---|---|---|---|
| 1 | |
18 ms | 720 ms | 97% |
| 2 | Kinsta |
22 ms | 229 ms | 90% |
| 3 | |
36 ms | 304 ms | 88% |
| 4 | |
44 ms | 1,163 ms | 96% |
| 5 | |
62 ms | 1,412 ms | 96% |
| 6 | |
109 ms | 132 ms | 18% |
| 7 | o2switch |
112 ms | 1,203 ms | 91% |
| 8 | |
149 ms | 870 ms | 83% |
| 9 | WPX Hosting |
161 ms | 1,397 ms | 89% |
| 10 | |
161 ms | 207 ms | 22% |
| 11 | Ikoula |
173 ms | 1,264 ms | 86% |
| 12 | |
173 ms | 966 ms | 82% |
| 13 | The Onion Host |
177 ms | 1,645 ms | 89% |
| 14 | |
181 ms | 298 ms | 39% |
| 15 | RackNerd |
184 ms | 511 ms | 64% |
| 16 | Time4VPS |
189 ms | 187 ms | 0% |
| 17 | Ultahost |
202 ms | 1,019 ms | 80% |
| 18 | DreamHost |
208 ms | 1,145 ms | 82% |
| 19 | |
219 ms | 221 ms | 1% |
| 20 | VPSDime |
237 ms | 233 ms | 0% |
| 21 | |
245 ms | 582 ms | 58% |
| 22 | Namecheap |
248 ms | 245 ms | 0% |
| 23 | Hetzner |
255 ms | 311 ms | 18% |
| 24 | AlphaVPS |
259 ms | 569 ms | 54% |
| 25 | Impreza.host |
260 ms | 258 ms | 0% |
| 26 | |
270 ms | 459 ms | 41% |
| 27 | Bluehost |
341 ms | 301 ms | 0% |
| 28 | GoDaddy |
352 ms | 348 ms | 0% |
| 29 | Nexcess (Liquid Web) |
358 ms | 634 ms | 44% |
| 30 | |
362 ms | 331 ms | 0% |
| 31 | |
369 ms | 1,045 ms | 65% |
| 32 | |
377 ms | 480 ms | 21% |
| 33 | AccuWeb Hosting |
385 ms | 546 ms | 29% |
| 34 | Black.host |
408 ms | 507 ms | 20% |
| 35 | |
440 ms | 704 ms | 38% |
| 36 | Hosting.com (formerly A2 Hosting) |
451 ms | 466 ms | 3% |
| 37 | Infomaniak |
452 ms | 450 ms | 0% |
| 38 | |
502 ms | 654 ms | 23% |
| 39 | |
519 ms | 510 ms | 0% |
| 40 | |
547 ms | 533 ms | 0% |
| 41 | |
567 ms | 575 ms | 2% |
| 42 | |
673 ms | 669 ms | 0% |
| 43 | OVHcloud |
737 ms | 732 ms | 0% |
| 44 | FlokiNET |
837 ms | 833 ms | 0% |
| 45 | |
844 ms | 840 ms | 0% |
| 46 | |
1,199 ms | 1,228 ms | 2% |
| 47 | |
1,288 ms | 1,321 ms | 3% |
| 48 | MochaHost |
3,954 ms | 3,822 ms | 0% |
A "cache saved" figure near 0% means the cached and uncached requests took the same time. Either the sites have no page cache, or their cache also answered the uncached requests.
Benchmark test 4: Response time under light load
The p95 response time is the full response time (first byte plus the rest of the page's HTML) that 95% of requests beat during the 2-minute run. It shows slow spikes that an average hides. With about 1 request per second, this is light load, so it isn't a test of how a host copes with a traffic surge. Each host's figure is the median of its sites.
| Rank | Host | p95 response time | Failed requests |
|---|---|---|---|
| 1 | |
297 ms | 0 |
| 2 | VPSDime |
298 ms | 0 |
| 3 | |
304 ms | 0 |
| 4 | Kinsta |
308 ms | 0 |
| 5 | Bluehost |
363 ms | 0 |
| 6 | |
390 ms | 0 |
| 7 | Hetzner |
428 ms | 0 |
| 8 | Namecheap |
434 ms | 0 |
| 9 | |
439 ms | 0 |
| 10 | Time4VPS |
451 ms | 0 |
| 11 | |
464 ms | 0 |
| 12 | GoDaddy |
546 ms | 0 |
| 13 | |
650 ms | 0 |
| 14 | Black.host |
670 ms | 0 |
| 15 | AccuWeb Hosting |
682 ms | 0 |
| 16 | |
721 ms | 0 |
| 17 | RackNerd |
724 ms | 0 |
| 18 | Infomaniak |
726 ms | 0 |
| 19 | Hosting.com (formerly A2 Hosting) |
737 ms | 0 |
| 20 | Impreza.host |
748 ms | 0 |
| 21 | |
794 ms | 0 |
| 22 | |
807 ms | 0 |
| 23 | Nexcess (Liquid Web) |
842 ms | 0 |
| 24 | |
852 ms | 0 |
| 25 | Ultahost |
852 ms | 0 |
| 26 | |
911 ms | 0 |
| 27 | |
918 ms | 0 |
| 28 | |
945 ms | 0 |
| 29 | |
981 ms | 0 |
| 30 | |
1,001 ms | 0 |
| 31 | OVHcloud |
1,038 ms | 0 |
| 32 | AlphaVPS |
1,045 ms | 0 |
| 33 | FlokiNET |
1,175 ms | 0 |
| 34 | |
1,274 ms | 0 |
| 35 | |
1,325 ms | 0 |
| 36 | |
1,325 ms | 0 |
| 37 | |
1,438 ms | 0 |
| 38 | |
1,480 ms | 0 |
| 39 | o2switch |
1,544 ms | 0 |
| 40 | |
1,686 ms | 0 |
| 41 | WPX Hosting |
1,704 ms | 0 |
| 42 | |
2,016 ms | 0 |
| 43 | Ikoula |
2,020 ms | 0 |
| 44 | The Onion Host |
2,103 ms | 0 |
| 45 | DreamHost |
2,212 ms | 0 |
| 46 | |
2,248 ms | 0 |
| 47 | |
2,360 ms | 0 |
| 48 | MochaHost |
5,793 ms | 0 |
The failed-request column counts HTTP errors and timeouts during each host's runs; across all 186 runs there were 0.
Beyond the benchmarks: analysis
Shared vs VPS vs managed hosting
| Hosting type | Sites | Hosts | Server time (est.) | Uncached TTFB | Cached TTFB | p95 response time |
|---|---|---|---|---|---|---|
| Shared hosting | 86 | 30 | 534 ms | 641 ms | 344 ms | 943 ms |
| VPS / cloud | 88 | 32 | 327 ms | 421 ms | 261 ms | 656 ms |
| Managed WordPress / builder | 12 | 4 | 671 ms | 673 ms | 28 ms | 1,035 ms |
VPS and cloud sites had a lower median server time than shared hosting sites (327 ms against 534 ms). That fits how the products work: a VPS keeps its CPU and RAM for one customer's sites, while a shared server splits them between many accounts.
The managed group is small (12 sites on Kinsta, WP Engine, Nexcess (Liquid Web) and Wix), so its median is less reliable than the other two.
Consistency between a host's sites
A host where every site performs alike is easier to predict. These hosts had the biggest gaps between their fastest and slowest site:
| Host | Fastest site | Slowest site | Gap |
|---|---|---|---|
|
151 ms | 15,913 ms | 15,762 ms |
| MochaHost |
390 ms | 12,363 ms | 11,972 ms |
| Ultahost |
166 ms | 7,622 ms | 7,457 ms |
|
347 ms | 4,953 ms | 4,606 ms |
| DreamHost |
239 ms | 4,447 ms | 4,208 ms |
|
452 ms | 4,642 ms | 4,190 ms |
| RackNerd |
117 ms | 3,391 ms | 3,273 ms |
| Ikoula |
99 ms | 3,158 ms | 3,059 ms |
And these had the smallest:
| Host | Fastest site | Slowest site | Gap |
|---|---|---|---|
| The Onion Host |
1,515 ms | 1,523 ms | 7 ms |
| Impreza.host |
106 ms | 124 ms | 19 ms |
| Namecheap |
119 ms | 140 ms | 21 ms |
|
257 ms | 280 ms | 23 ms |
|
129 ms | 204 ms | 75 ms |
|
155 ms | 269 ms | 114 ms |
| Bluehost |
149 ms | 386 ms | 237 ms |
|
455 ms | 727 ms | 273 ms |
A narrow gap isn't automatically good. The Onion Host's sites were close together, but all slow on uncached pages; Impreza.host's were close and fast.
Distance and server location
Server location matters most for the uncached pages that skip the cache. A visitor in the US loading a page from a server in Singapore waits about 209 ms longer than one loading it from a US server, before the server does any work. A CDN can hide that for cached pages, but not for pages it can't cache.
If your audience is in one region, pick a host with a data center there first, then compare server times within that shortlist.
What these results don't tell you
- They aren't controlled tests. The sites run different themes, plugins and amounts of content, on plans I don't know. A host's result describes the sites tested, not every plan it sells.
- The samples are small. With 2 to 6 sites per host, the median limits the effect of one unusual site, but a different set of sites could still move a host up or down.
- One test location. Everything was measured from Ashburn, US. Server time removes most of the distance, but a host can still perform differently for visitors elsewhere.
- Light load only. At about 1 request per second, these runs don't show how a host copes with a traffic spike.
- No uptime yet. This round only covers speed.
Retests, corrections and changelog
If you run one of the hosts tested here and think a result is wrong, or you'd like a retest, contact me with the details. A host can't pay for a better place or a retest.
- November 2026: host figures changed from the average of 2 to 4 sites to the median of up to 3 sites per hosting type. Test pages under 30 KB or over 500 KB were replaced, Cloudways sites no longer count for DigitalOcean or Vultr, and Cherry Servers was added: 48 hosts and 186 websites.
- 2026: first edition. 47 hosts and 128 websites tested with k6 from Ashburn, US.
FAQ
Which web host is the fastest?
In this round, AWS had the lowest server time (64 ms), followed by Time4VPS (67 ms) and Impreza.host (121 ms)., and each host was tested on 2 to 6 websites, so the order can change between rounds.
Is a VPS faster than shared hosting?
In these tests it was: VPS and cloud sites had a median server time of 327 ms, shared hosting sites 534 ms. A VPS still needs a sensible setup; some unmanaged VPS sites in this test were slower than good shared hosting sites.
What is a good TTFB for a website?
Google's guideline for a good TTFB is 800 ms or less, measured on real visits. For the server's own work, the median host in this test needed 494 ms of server time on uncached pages; with a working page cache, most sites delivered the first byte much faster.
Why are some hosts with fast servers ranked low on TTFB?
Because of distance. All tests ran from Ashburn, US, so hosts with servers in Europe or Asia start 81 to 285 ms behind. Server time removes that round trip, which is why it's the ranking figure.